
[email protected] | Call/Text 604-276-2335
Greater Vancouver Statistics Video:
Video Provided by Greater Vancouver Realtors
Home sales were down in August, marking the end of a summer season that underperformed the summer of 2025.
Get your free automated report on local housing conditions.
Statistics Reports by Area:
Click the Link for the Detailed Report
RICHMOND | LADNER | VANCOUVER WEST | VANCOUVER EAST |
BURNABY EAST | BURNABY NORTH | BURNABY SOUTH |
TSAWWASSEN | NORTH DELTA | WHITE ROCK |
Richmond and Greater Vancouver
Real Estate Market Update
September 2026 Update
What Sellers Need to Know from the August 2026 Market
Greater Vancouver Market Overview: Slower Summer Closes with Buyer Advantage
Across Metro Vancouver, the real estate market wrapped up the summer season along a quiet, orderly, and price-sensitive trajectory. August marked another month where overall demand lagged seasonal averages, while elevated inventory provided active buyers with an uncommon amount of leverage and selection.
According to Greater Vancouver REALTORS® (GVR), residential sales registered across the region reached 1,869 in August 2026:
Sales Volume: Down 4.6% compared to August 2025 (1,959 sales) and 20.7% below the region’s 10-year seasonal average (2,356).
New Inventory: Realtors placed 4,100 properties on the MLS®, down 3.0% from last year and 1.3% below seasonal norms.
Active Inventory: Total active listings stood at 15,798 - though easing slightly by 2.7% year-over-year, this remains 26.2% above the 10-year seasonal average (12,522).
Composite Benchmark Price: The MLS® Home Price Index composite benchmark price for all residential properties across Metro Vancouver sits at $1,081,900, down 0.6% month-over-month and 5.6% year-over-year.
Regional Sales-to-Active Ratios & Market Segments
The region-wide sales-to-active listings ratio settled at 12.3% in August, hovering right on the borderline between a balanced market and buyer's market conditions:
Detached Homes: 9.6% (Buyer’s Market) - Regional benchmark: $1,799,400 (-7.2% YoY; -1.3% MoM)
Townhomes / Attached: 15.1% (Balanced Market) - Regional benchmark: $1,028,800 (-4.4% YoY; -0.2% MoM)
Condominiums / Apartments: 13.7% (Balanced / Soft Market) - Regional benchmark: $686,200 (-6.6% YoY; -0.3% MoM)
As noted by GVR Chief Economist Andrew Lis, slower-than-usual summer sales paired with ample property selection have caused prices to gently drift downward across all categories. While mortgage rates have stabilized and prices have softened, buyers are taking their time, weighing options carefully against broader economic headwinds, reduced investor activity, and shifting immigration trends.
Executive Summary: Richmond & South Delta
If you’re thinking about selling in Richmond, Steveston, Ladner, or Tsawwassen, August brought clear signals that the late-summer market has mirrored this broader regional moderation.
With overall inventory sitting comfortably above historical norms, local buyers have ample choice, while sellers must navigate muted overall transaction volumes.
That said, this remains a market that rewards smart pricing, strong presentation, and local strategy. Buyers have more choice than they’ve had in years, and overpriced homes are consistently being passed over.
The good news? Well-priced, turnkey properties continue to sell, and sellers who position realistically right from day one can still achieve strong, predictable outcomes.
Quick Take: What’s Happening in the Richmond Market?
Here’s the short version:
Overall sales activity remains subdued: Regional demand continues to trend below long-term seasonal averages.
Inventory is stable: Active listings eased slightly from July peaks but remain at healthy levels, giving buyers strong comparison leverage.
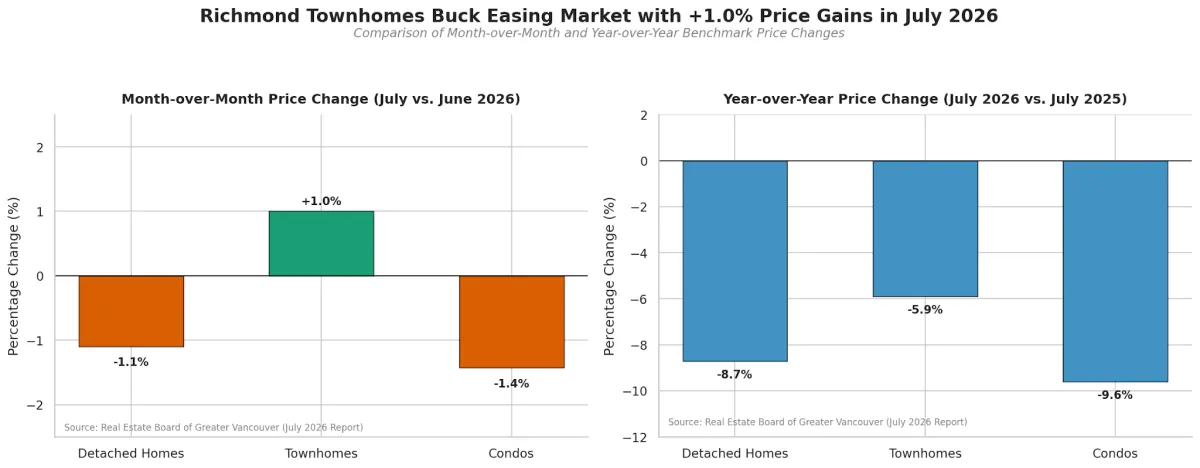
Prices show modest easing: Benchmark values drifted down month-over-month across attached segments and sit roughly 4% to 10% below August 2025 levels depending on property type.
Market segmentation persists: Detached homes remain firmly in buyer’s market territory, condos have balanced out slightly in volume but face price softening, and townhomes continue to hold the steadiest ground.
Well-presented homes attract serious buyers: Buyers are active, but they are patient and value-driven.
Pricing strategy is paramount: Testing the market with aspirational pricing continues to backfire.
In other words, this is not a panic market, but it’s certainly not a market where sellers can simply test an ambitious number and expect multiple offers.
Is Richmond a Buyer’s Market or a Seller’s Market Right Now?
Right now, Richmond is straddling buyer’s market and balanced market territory, depending entirely on the property type.
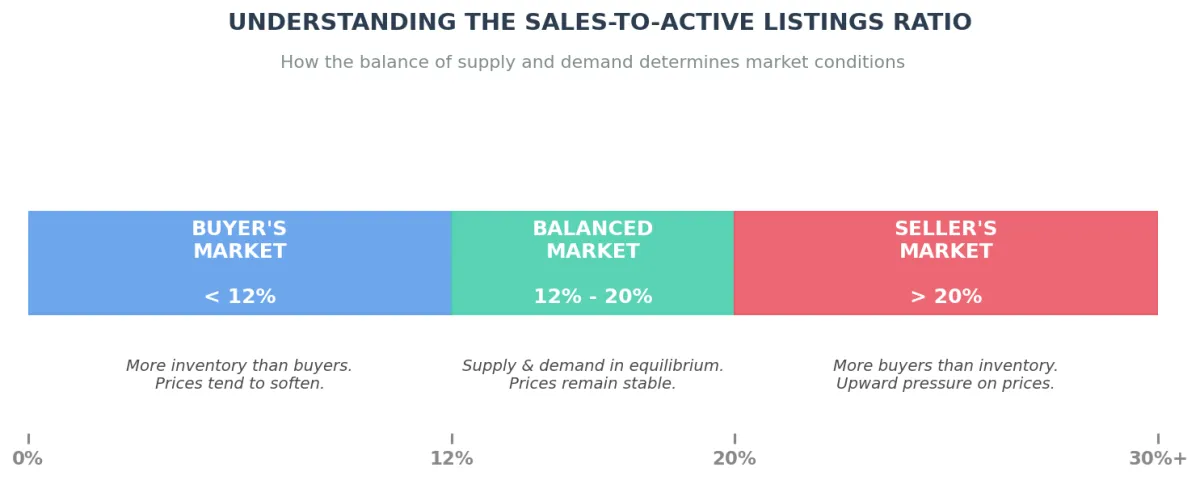
The sales-to-active listings ratio is one of the most reliable indicators of market speed:
Below 12% = Buyer’s Market (downward pressure on prices)
12% to 20% = Balanced Market
Above 20% = Seller’s Market (upward pressure on prices)
As of August 2026:
Detached homes in Richmond sit in buyer’s market territory at a 7.5% ratio (SnapStats reports 8%).
Townhomes remain balanced at a 16.7% ratio.
Condos hover in the balanced zone at a 12.1% ratio (attached segment overall sits at 13% on SnapStats).
Each property category is operating under distinctly different competitive conditions.
Richmond Market Snapshot – August 2026
Richmond Detached Homes
Benchmark Price: $1,925,400
Year-over-Year Change: -7.8%
Sales-to-Active Ratio: 7.5%
Market Type: Buyer’s Market
Richmond Townhomes
Benchmark Price: $1,022,200
Year-over-Year Change: -4.1%
Sales-to-Active Ratio: 16.7%
Market Type: Balanced Market
Richmond Condos
Benchmark Price: $633,300
Year-over-Year Change: -9.8%
Sales-to-Active Ratio: 12.1%
Market Type: Balanced / Soft Buyer’s Market
Ladner (Detached)
Median Selling Price: $1,315,000*
Month-over-Month Change: -2.6% (from July's $1,350,000 median)
Sales-to-Active Ratio: 13%*
Market Type: Balanced Market
Tsawwassen (Detached)
Median Selling Price: $1,420,000*
Month-over-Month Change: -6.6% (from July's $1,520,000 median)
Sales-to-Active Ratio: 13%*
Market Type: Balanced Market
*South Delta statistics represent detached property metrics from the August 2026 SnapStats® report.
GET YOUR HOME VALUE REVIEW HERE
What This Means for Richmond Home Sellers
The defining characteristic of today’s market is buyer selectivity. With borrowing costs holding steady and inventory readily available, purchasers are under no pressure to rush. They are scrutinizing listings thoroughly and bypassing properties that feel overpriced, under-prepared, or poorly maintained.
Sellers need to approach the market intentionally. Listings achieving solid sales usually share three characteristics:
They are priced to current fair value from day one.
They present exceptionally well online and in person.
They align with the functional layouts and features today's buyers prioritize.
Why Pricing Matters So Much Right Now
Trying to "test the market" remains the single most common pitfall in today's environment. In a cooling or balanced market, an overpriced listing rarely attracts strong opening buzz.
What happens to overpriced listings today?
They see immediate drop-offs in online traffic.
Showings stall, and average days on market accumulate rapidly.
Buyers begin to speculate about potential defects or assume seller inflexibility.
They ultimately end up selling for less than they would have had they launched at fair market value.
The first two to three weeks of exposure are the most crucial window. If you want genuine buyer interest, your property needs to represent clear, compelling value compared to competing inventory.
Richmond Detached Homes: Still a Buyer's Advantage
Detached single-family homes continue to face softer conditions in Richmond.
August 2026 Richmond Detached Stats:
Active Listings: 651
Sales: 49
Average Days on Market: 44
Benchmark Price: $1,925,400
Year-over-Year Price Change: -7.8%
A sales-to-active ratio of 7.5% confirms that buyers hold the leverage in this bracket. Detached homes are definitely selling - 49 closed in August, but sellers are competing directly against over 650 active listings. Success demands competitive pricing and pristine property presentation.
Townhomes and Condos Show Mixed Stability
While townhomes continue to display balanced stability, condos have absorbed larger price adjustments over the past 12 months.
August 2026 Townhome Stats:
Active Listings: 353
Sales: 59
Average Days on Market: 44
Benchmark Price: $1,022,200
Year-over-Year Price Change: -4.1%
August 2026 Condo Stats:
Active Listings: 919
Sales: 111
Average Days on Market: 52
Benchmark Price: $633,300
Year-over-Year Price Change: -9.8%
The Move-Up Window
For condo and townhome owners considering a jump to a detached home, this environment presents an intriguing opportunity. While strata values have softened, the detached segment has experienced significant price adjustment over the past two years. The net dollar spread required to move from an attached home into a detached house is more accessible than it was during peak market surges.
Steveston Real Estate Update
Steveston remains one of Richmond’s premier lifestyle communities. While its long-term desirability is unquestioned, the neighbourhood is not immune to broader macro adjustments.
August 2026 Detached Benchmark Values across Steveston:
Steveston North: $1,561,400 (down 8.6% year-over-year)
Steveston South: $1,779,800 (down 7.0% year-over-year)
Steveston Village: $1,716,900 (down 6.6% year-over-year)
Demand remains resilient for updated, family-oriented properties in strong school catchments. Move-in-ready townhomes and well-maintained detached homes in walkable Steveston pockets continue to see healthy interest when priced accurately.
Terra Nova and West Richmond Market Trends
West Richmond and luxury pockets like Terra Nova reflect the wider detached moderation while maintaining an enduring foundation for upscale buyers.
Terra Nova Detached Benchmark Price: $2,183,400 (down 8.1% year-over-year)
High-end buyers are notably cautious with respect to price per square foot, lot attributes, and overall finishing quality. With days on market climbing in luxury brackets, overpricing quickly erodes a listing’s momentum. Precise positioning is essential.
Ladner and Tsawwassen Real Estate Update
South Delta continues to appeal strongly to families and move-up purchasers looking for larger lots, quieter streets, and strong relative value compared to central Vancouver and Richmond.
August 2026 South Delta Detached Stats:
Ladner: Detached median sale price of $1,315,000 with a sales-to-active ratio of 13% (Balanced Market).
Tsawwassen: Detached median sale price of $1,420,000 with a sales-to-active ratio of 13% (Balanced Market).
Both Ladner and Tsawwassen detached segments shifted into balanced territory in August. While homes are trading close to list price (averaging 95%–99% of list price), transactions take deliberate effort, with average days on market hovering around 23 to 37 days.
What Buyers Should Know Right Now
For buyers, current conditions offer rare breathing room.
Today’s market allows prospective purchasers to:
Include reasonable financing and subject clauses.
Conduct comprehensive home and sewer inspections without deadline pressure.
Review strata depreciation reports, contingency funds, and minutes thoroughly.
Negotiate on price, closing dates, and inclusion terms.
For anyone who sat out previous hyper-competitive bidding cycles, this season offers selection and negotiation leverage.
My Take on the August 2026 Richmond Market
This is a more functional, rational market than negative headlines suggest. While sales volumes have moderated and price growth has cooled, active buying and selling are very much taking place.
The market has simply transitioned from a momentum-driven seller's market to a discipline-driven market. Properties with thoughtful staging, professional digital marketing, and realistic pricing are finding buyers. Those that rely on outdated pricing expectations or lackluster marketing are sitting. Local insight and execution make all the difference.
Thinking About Selling in Richmond or Greater Vancouver?
If you want to know what your home could realistically sell for in today’s changing landscape, I am here to help. I work closely with homeowners across Richmond, Steveston, Ladner, Tsawwassen, and Greater Vancouver to provide:
A realistic assessment of your home’s value in the current August/September market.
Direct insight into your exact active competition and recent comparable sales.
A clear, bespoke marketing and pricing strategy tailored to your timeline.
Reach out anytime for an honest, data-backed perspective on your home.

This representation is based in whole or in part on data generated by the Chilliwack & District Real Estate Board, Fraser Valley Real Estate Board or Greater Vancouver REALTORS® which assumes no responsibility for its accuracy. © Copyright 2026 by the Greater Vancouver REALTORS®, Fraser Valley Real Estate Board, Chilliwack and District Real Estate Board, and BC Northern Real Estate Board. All Rights Reserved. | © 2026 REMAX Michael Cowling and Associates Realty. All Rights Reserved.
This is a Paragraph Font
Facebook
Instagram
LinkedIn
Youtube
X
TikTok